How to Determine Performance Bottlenecks
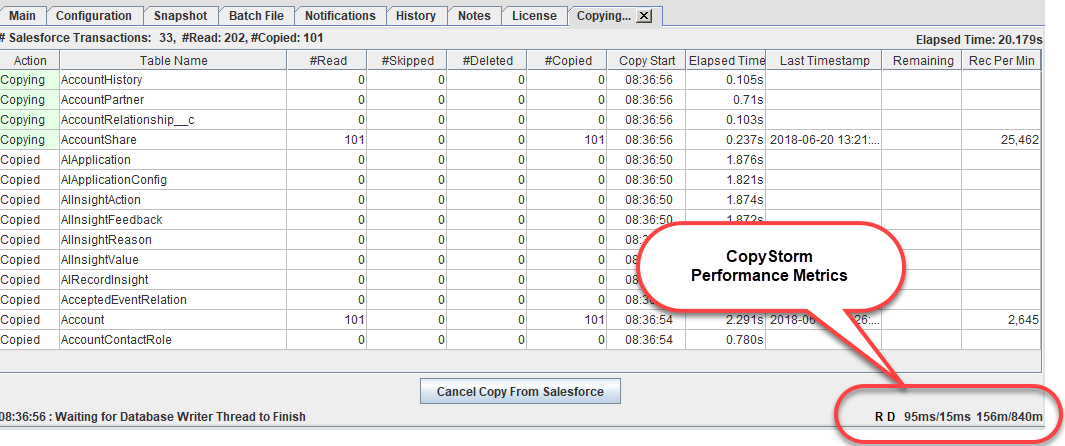
The CopyStorm “Copying…” tab has real-time metrics which help identify a components that are limiting the speed of a database backup. The metrics, located in the lower right hand corner of a “Copying…” tab are described in this article.
There are two primary factors which limit the speed of a CopyStorm job:
- The rate at which Salesforce delivers data to CopyStorm.
- The rate at which the target database accepts data from CopyStorm.
Metrics highlighted in the following image provide data indicating which component is the bottleneck at your site:

Metrics are divided into three sections:
| Section | Sample Data | Description |
|---|---|---|
| Read/Write Threads | S D | The “S” and “D” values indicate thread execution status:
When a “S” thread is BLUE then it is either reading data from Salesforce or waiting for Salesforce to respond to a read request. When a “D” thread is BLUE then it is writing data to the target database. When either type of thread is GREY then it has nothing to do or is waiting for the other thread type to catch up. |
| Data Throughput | 44ms/16ms | These two numbers indicate:
|
| Memory Usage | 84m/201m | These two numbers indicate:
|
In a balanced system:
- The “S” threads will be blinking blue almost all of the time.
- This means that a steady stream of data is being delivered from Salesforce.
- The “D” threads will be grey most of the time but blinking blue rapidly.
- The data throughput values will be less than 50ms and the database write speed will be less than 20ms.
In a system where the database is the bottleneck:
- The “S” threads will often turn grey.
- The “D” threads will be blue most of the time.
- The database write speed will be large.
- This value is elapsed time for a single request to the database to write a block of records.
- For example, if the “Destination Batch Size” is 100 and the database write speed is 4500ms then this means that the database is taking 4.5 seconds to write 100 records (e.g. terrible performance).
In a system where Salesforce is the bottleneck:
- The “S” threads will be solid blue most of the time.
- This means that they are waiting for a response from Salesforce.
- The “D” threads will be grey most of the time.
- The first data throughput number will be large.
- This number indicates how frequently a buffer is ready to be written to the database.
- The second data throughput number will be small.
Common Problems
Problem #1: Proximity of CopyStorm and the Database
The most common issue we see is that CopyStorm and the database are not in the same data center. The underlying issue is that the protocols used to talk to relational databases require close proximity between the application and the database for great performance. Until we discover a way to increase the speed of light, CopyStorm running in India and talking to a database in Canada will give slow performance. You can solve this problem by running CopyStorm and its corresponding database in the same data center.
Problem #2: Overloaded Database
CopyStorm will write data to a database as quickly as Salesforce delivers it. If the “S” threads are grey, the “D” threads are blue, the data throughput numbers are large, and you are sure that CopyStorm and the database are in the same data center; then the database is likely overloaded. Using system monitoring tools on the database computer will quickly pinpoint the issue — often the database computer will be page-faulting like crazy.
Problem #3: Slow Internet
If the CopyStorm “S” threads are solid blue, the “D” threads are almost always grey, and the first data throughput number is large; then Salesforce is not delivering data rapidly. Even with a modest internet bandwidth of 20M/s, CopyStorm can easily transfer 20,000 – 30,000 accounts per minute. If you are sure that your available bandwidth is high then see your system administrators. There may be network software inspecting and slowing packets from Salesforce.
Problem #4: Overloaded Client Computer
Though CopyStorm’s runtime requirements are modest, it cannot control demands made by other applications. Use a local system monitor to see which applications are using a high amount of CPU time. On a balanced system CopyStorm will always be consuming CPU — reading from Salesforce and writing to the target database.
